Vehicle Pollution Explained
Cars, vans, buses and lorries don’t just emit one type of pollution. Exhaust gases, tiny particles, tyre and brake dust, oil leaks and even plastics from tyres and road markings all contribute to the mixture of pollutants we breathe and that end up in soils and rivers. This page breaks down the main types of vehicle pollution in plain English, explains where they come from, and shows why newer engines and cleaner driving habits make such a difference to local air quality.
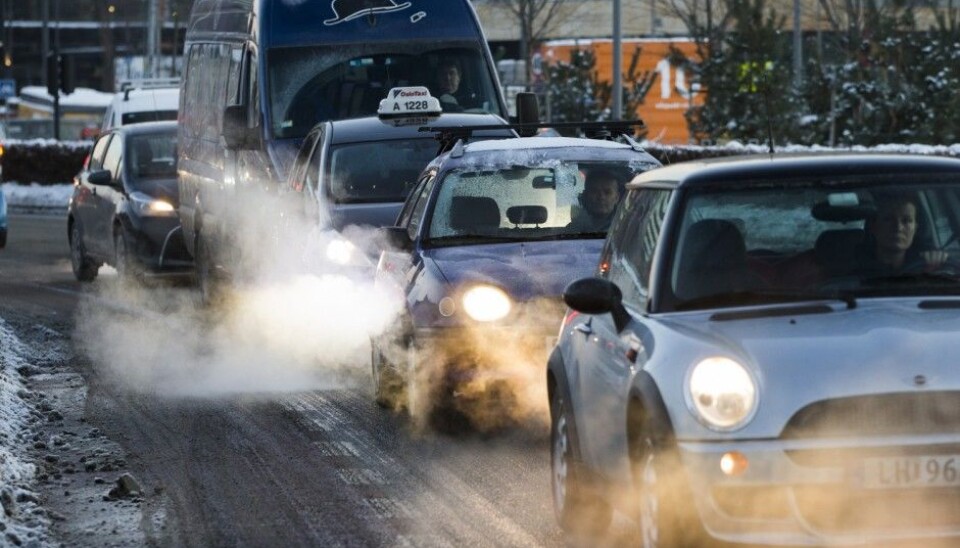
Figure 1: Vehicle exhaust with visible fumes in city traffic, highlighting exhaust pollution.
At a glance: what do vehicles actually emit?
Road transport is one of the largest sources of nitrogen oxides (NOx) and a major source of fine particulate matter (PM2.5 and PM10) in the UK, even though exhaust emissions have fallen sharply as engines have become cleaner. At the roadside, people are exposed to a whole mix of pollutants, not just “exhaust fumes”. Measurements in High Barnet also showed much higher NOx and particulate levels along busy streets at rush hour compared with quieter locations and weekend periods, underlining this traffic link at a local scale.
| Pollutant | Main source from vehicles | Why it matters | Exhaust or non-exhaust? |
|---|---|---|---|
| Particulate matter (PM10, PM2.5, ultrafine) | Tiny solid and liquid particles from exhaust, brake wear, tyre wear, road dust and soot | Penetrates deep into lungs and blood; linked to heart and lung disease and reduced life expectancy. | Both – exhaust and non-exhaust (brakes, tyres, road wear) |
| Nitrogen oxides (NOx: NO and NO2) | High-temperature combustion in petrol and especially diesel engines | Can irritate airways, worsen asthma and form ozone and secondary particles in the atmosphere. | Exhaust |
| Carbon monoxide (CO) | Incomplete burning of fuel, especially from older or poorly maintained engines | Reduces the blood’s ability to carry oxygen at high concentrations; indicator of inefficient combustion. | Exhaust |
| Carbon dioxide (CO2) | Normal combustion of petrol and diesel fuel | Major greenhouse gas driving climate change; not toxic at outdoor levels but tightly linked to fuel use and traffic volume. | Exhaust |
| Volatile organic compounds (VOCs) | Unburnt fuel vapour, exhaust gases, some motor oils and cleaning fluids | Includes benzene and 1,3-butadiene; can cause cancer and help form ground-level ozone when mixed with NOx and sunlight. | Mostly exhaust and fuel/evaporation |
| Sulphur dioxide (SO2) and sulphate particles | Sulphur in fuel (much lower now due to fuel standards) and some lubricating oils | Can irritate airways and forms sulphate particles; now relatively small for road vehicles compared to the past. | Exhaust |
| Tyre wear particles & microplastics | Tyres shedding rubber and plastic as they wear against the road | Microplastics accumulate in soil and waterways; a growing source of PM and plastic pollution in Europe. | Non-exhaust |
| Brake dust & metal particles | Brake pads and discs wearing down during braking | Rich in metals like copper, iron and antimony; particles can be highly toxic to lung cells and now form a large share of urban PM. | Non-exhaust |
| Oil, fuel and fluid leaks | Engine oil, fuel, brake fluid and coolant dripping or spilled onto roads | Runoff can contaminate soils, rivers and groundwater, carrying hydrocarbons and metals into the wider environment. | Non-exhaust / drips and spills |
| Ground-level ozone (O3) | Not emitted directly – formed in the air when NOx reacts with VOCs in sunlight | Can irritate eyes and lungs; particularly harmful for children and people with asthma during summer smog episodes. | Secondary pollutant from traffic emissions |
Particulate matter (PM10, PM2.5 and ultrafine particles)
Particulate matter is the catch-all term for tiny solid and liquid particles suspended in the air, essentially “everything that isn’t a gas”. For vehicles, this includes soot from exhausts, metal and carbon dust from brakes, rubber and plastic from tyres, and particles worn off the road surface and lifted back into the air by passing traffic (road dust resuspension).
PM is usually grouped by size. PM10 are particles smaller than 10 micrometres across (about one fifth of a human hair), PM2.5 are smaller than 2.5 micrometres, and “ultrafine” particles are below 0.1 micrometres. The smaller the particle, the deeper it can travel into the lungs and the more easily it can pass into the bloodstream. UK assessments class PM2.5 as one of the highest-risk pollutants for health, with thousands of premature deaths each year linked to long-term exposure.
Research in Barnet found that PM2.5 and PM10 were noticeably higher on busy high streets and during weekday evening rush hours than on quieter roads and weekends, which matches the national picture: transport contributes around one fifth of UK PM2.5 and PM10 emissions, and road transport PM is now dominated by non-exhaust sources like brakes and tyres rather than exhaust pipes.
Nitrogen oxides (NOx)
Nitrogen oxides (NOx) mainly consist of nitric oxide (NO) and nitrogen dioxide (NO2). They are formed when fuel burns at high temperature in engines. Road transport is still responsible for almost half of UK NOx emissions, even though levels have fallen as newer Euro standards have been introduced.
NO2 irritates the lining of the lungs and can worsen asthma and other respiratory conditions. It also helps form ozone and additional particulate matter in the atmosphere. NOx levels are significantly higher near congested roads and busier junctions, particularly around school times and weekday evenings, underlining the link between local traffic, congestion and NOx exposure.
Carbon monoxide (CO)
Carbon monoxide is produced when fuel doesn’t burn completely, for example in cold engines, older vehicles or poorly maintained engines. Modern catalytic converters have reduced CO emissions sharply, but it remains a concern in enclosed or poorly ventilated spaces.
At very high concentrations CO can be life-threatening because it binds to haemoglobin in the blood more strongly than oxygen, effectively starving the body of oxygen. At outdoor roadside levels in the UK, it is more of a marker of inefficient combustion than a direct health threat, but reducing CO typically goes hand-in-hand with burning less fuel and cutting other pollutants too.
Carbon dioxide (CO2) and climate
CO2 is different from the toxic air pollutants above. It is not harmful at the concentrations we normally breathe outdoors, but it is the main greenhouse gas from car and van tailpipes and directly linked to fuel use. More traffic, heavier vehicles and aggressive driving all mean more CO2.
UK transport statistics show that while NOx and PM from vehicles have fallen substantially since 1990, CO2 emissions from road transport remain high because overall traffic levels and trip distances have increased. Policy tools like ULEZ and Clean Air Zones mainly target local air pollutants, but they often encourage shifts to more efficient or electric vehicles, which brings climate benefits as well.
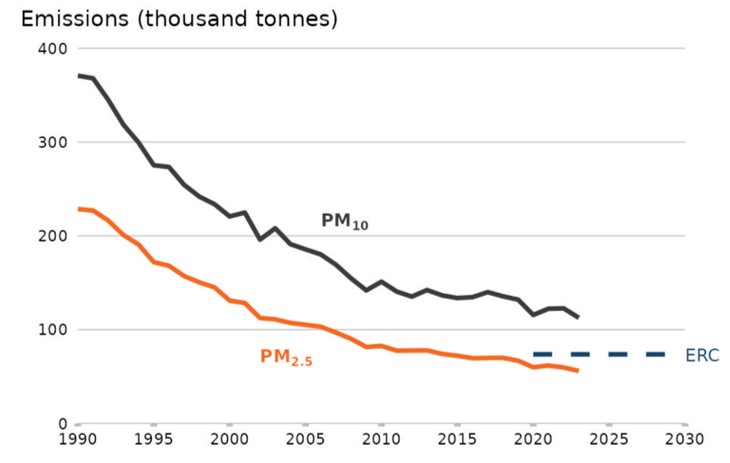
Figure 2: DEFRA Annual Emissions of PM10 and PM2.5 in the UK 1990-2023
VOCs, benzene and ground-level ozone
Volatile organic compounds (VOCs) are a broad family of gases that evaporate easily. From vehicles they mainly come from unburnt fuel in exhaust, fuel evaporation and some solvents. The UK air pollution monitoring network tracks several VOCs that are particularly harmful, including benzene and 1,3-butadiene.
Some VOCs are directly toxic or carcinogenic. Others react with NOx in sunlight to create ground-level ozone, which can cause chest tightness, coughing and breathing difficulties during summer smog episodes, especially for people with existing lung or heart disease. Reducing NOx and VOCs from traffic therefore helps cut both direct and indirect health impacts.
Sulphur and older fuel pollution
Sulphur dioxide (SO2) used to be a more important pollutant from vehicles, especially when fuel contained higher sulphur levels. Tight fuel quality standards have cut sulphur in petrol and diesel to very low levels in the UK, so most SO2 now comes from other sectors such as industry and shipping rather than cars.
However, sulphur in fuel can still contribute to sulphate particles and interact with other pollutants. Cleaning up fuel quality has been one of the quiet success stories in air quality policy, and is one reason why modern engines, when properly maintained, emit far less sulphur pollution than older models.
Tyre wear, microplastics and road dust
Every time a tyre rolls, accelerates or brakes, tiny fragments of rubber and plastic are shaved off and left on the road surface. These particles can be churned back into the air as PM10 and PM2.5, or washed into drains and rivers as microplastics. European estimates suggest tyre abrasion may account for around one-third to one-half of all microplastics unintentionally released to the environment, and 5–30% of road-transport particulate emissions.
UK government-commissioned work on non-exhaust emissions has highlighted tyre, brake and road wear as key sources of particles, with non-exhaust emissions now contributing a large share of road-traffic PM10 and PM2.5. These emissions occur even from zero-tailpipe electric vehicles, which is why simply electrifying cars is not enough to eliminate transport-related particulate pollution.
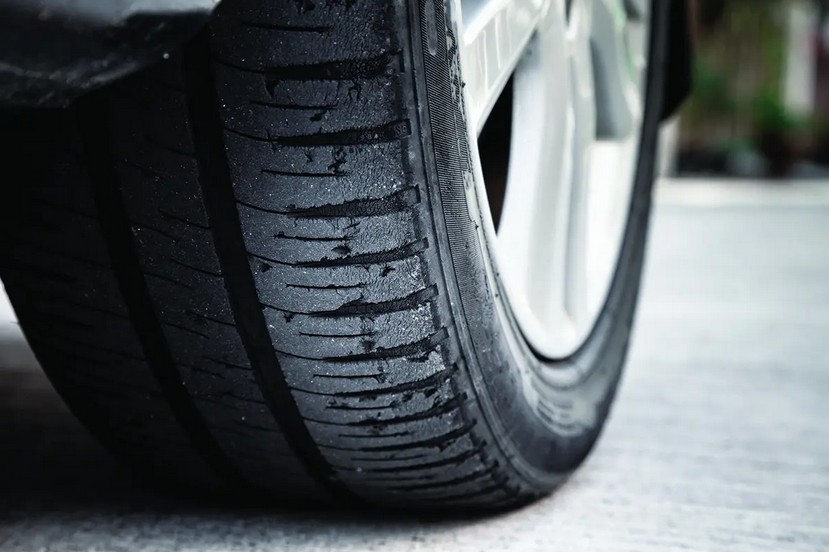
Figure 1: Vehicle tire with visible damage and degredation, highlighting microplastic pollution.
Brake dust and metal particles
When you press the brake pedal, pads clamp against discs, converting kinetic energy into heat – and shedding tiny fragments in the process. Brake dust is rich in metals such as iron, copper and antimony, as well as carbon and other compounds from the pad material. Government studies and academic research show that brake, tyre and road wear now dominate PM10 and PM2.5 emissions from road transport in many urban areas.
Toxicology studies suggest that some brake particles can be highly inflammatory to lung cells, in some tests causing stronger responses than diesel exhaust particles. While the science is still developing, it is clear that non-exhaust emissions are not benign dust – they can carry heavy metals and reactive compounds deep into the respiratory system.
Oil, fuel and other fluid contamination
Not all vehicle pollution goes into the air immediately. Leaks or spills of engine oil, fuel, brake fluid, gearbox oil and coolant can drip onto the road surface, where they build up in grime and sediment. During rain, this mixture can be washed into drains, streams and rivers, carrying hydrocarbons, metals and other chemicals into aquatic ecosystems.
Although more diffuse and less visible than exhaust plumes, these leaks contribute to wider environmental contamination. They are one reason why sustainable transport policies often emphasise mode shift to walking, cycling and public transport, not just cleaner engines.
Why newer engines can pollute less than smaller old ones
A common misconception is that “small engine = clean” and “big engine = dirty”. In reality, modern Euro-6/6d petrol and diesel engines with advanced after-treatment can emit far lower NOx and PM than older small-engined cars built to outdated standards. Research finds that traffic related pollution in Barnet was closely tied to congestion, braking and weekend vs weekday patterns, rather than engine size alone.
ULEZ and Clean Air Zones therefore focus on measured emissions standards (like Euro 4 petrol and Euro 6 diesel) and actual NOx/PM performance, not engine capacity. A well-maintained newer 3.0-litre car can easily produce less NOx and PM2.5 than an old, poorly maintained 1.2-litre city car. For drivers, the key is to look at emissions class and maintenance, not just the size printed on the boot lid.
Useful tools on this site
If you want to see how these pollutants link back to your own driving in London, you can use the tools below to check your vehicle, estimate costs and explore related guides:
References (Harvard style)
- Department for Environment, Food & Rural Affairs (Defra) (2024) Transport and environment statistics: domestic air pollution emissions from transport in 2022. GOV.UK. Available at: https://www.gov.uk (Accessed 11 December 2025).
- Department for Environment, Food & Rural Affairs (Defra) (2024) Air quality statistics in the UK, 1987 to 2023 – particulate matter (PM10/PM2.5). GOV.UK. Available at: https://www.gov.uk (Accessed 11 December 2025).
- UK Health Security Agency (UKHSA) (2022) Air pollution: applying All Our Health. GOV.UK. Available at: https://www.gov.uk (Accessed 11 December 2025).
- Office for Environmental Protection (2023) Air quality stocktake – technical report. Worcester: OEP.
- Department for Environment, Food & Rural Affairs (Defra) (2019) Non-exhaust emissions from road traffic. UK-AIR report.
- Department for Environment, Food & Rural Affairs (Defra) (2023) Measurement of emissions from brake and tyre wear. GOV.UK.
- European Commission Joint Research Centre (2023) Contribution of road vehicle tyre wear to microplastics and particulate matter emissions. Publications Office of the European Union.
- European Environment Agency (2025) Microplastic releases to the environment – indicator. Available at: https://www.eea.europa.eu (Accessed 11 December 2025).
- Parliamentary Office of Science and Technology (2023) Urban outdoor air quality. POSTnote 691. London: UK Parliament.
- Royal College of Physicians (2025) A breath of fresh air: addressing the health impacts of air pollution. London: RCP.
- Wac, K. (2025) The effectiveness of London’s Ultra Low Emission Zone (ULEZ) expansion in Barnet, North London. BSc Geography & Economics dissertation, University of Reading.